DonateJoinSign In

Forum for Illumination Research, Engineering, and Science (FIRES)

The ability to control fire is considered one of the most important factors in expanding and developing our human ancestors’ societies. The societal importance of fire required larger and larger groups to work together in order to maintain and sustain the fire; individuals had to work together to find fuel for the fire, maintain the fire, and complete other necessary tasks. Ultimately, fire had a significant influence on the development of language and the size and social interactions of communities.

The Forum for Illumination Research, Engineering, and Science (FIRES) is the IES online space for our lighting community to openly share and discuss the latest research and innovations in illumination engineering and science. As a space for the free dissemination of knowledge and exchange of ideas, FIRES is intended to foster relationships between individuals and larger institutions, and reignite the emphasis on science and engineering in the lighting industry. Through FIRES, we hope to have a significant influence on the development and advancement of lighting.
Share your Ideas!

To post an article in FIRES, go to our Policies and Submissions page.
Questions? research@ies.org

Editorial Disclaimer
The views expressed in articles published on FIRES do not necessarily reflect those of IES or represent endorsement by the IES.
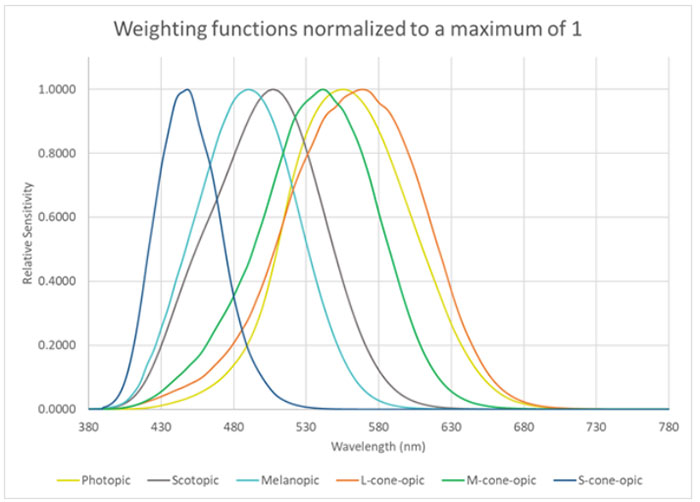
M/P Figure 1
Figure 1. From left to right: spectral efficiency curves of the S-cone, ipRGC (melanopic), rod (scotopic), M-cone, photopic response, and L-cone, all normalized to a maximum of 1.

M/P ratios – Can we agree on how to calculate them?

By Naomi J. Miller, PNNL; Anne (Lia) Irvin, PNNL The candela and the lumen are units based on one form of human spectral sensitivity, characterized with the weighting function known…
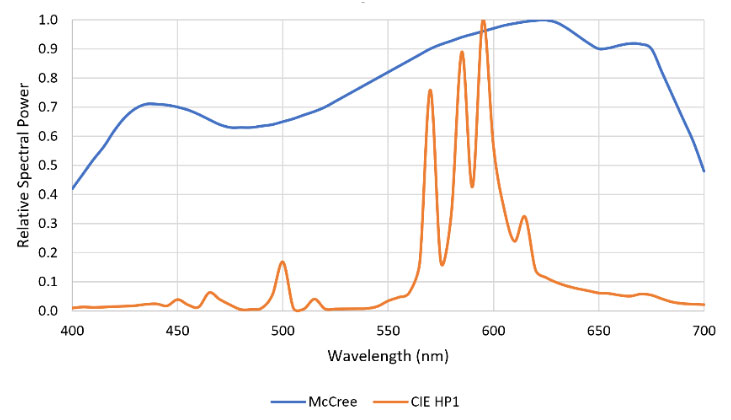
Figure 1. Typical HPS lamp spectral power distribution versus McCree curve.

Specifying LED Colors for Horticultural Lighting

By Ian Ashdown, Senior Scientist SunTracker Technologies Whereas human vision relies on five opsins as photoreceptors, most plants have a wide variety of photopigments that are responsive to optical radiation…
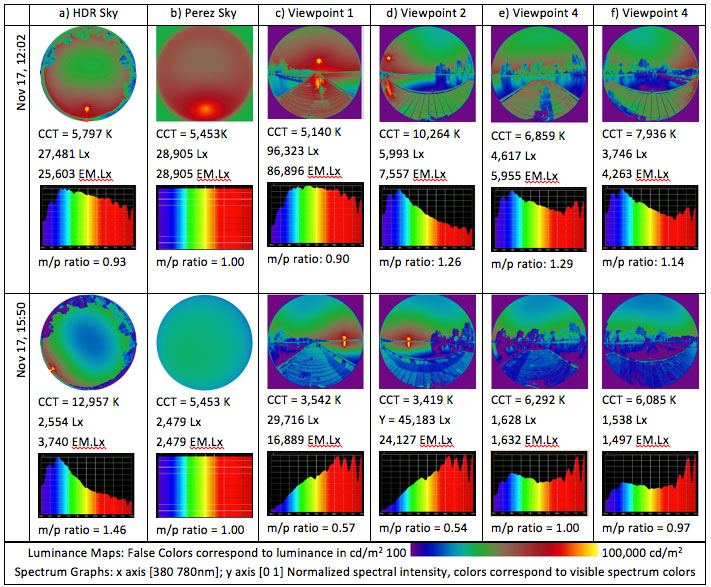
Figure 2.
Figure 2. Images a – b: comparison of HDR and equivalent Perez sky; images c – f: vertical viewpoints captured at eye level under the sky shown in a.

Focusing on Daylight Spectra

By Mehlika Inanici, Ph.D. The dynamic intensity and spectra of daylight inform human beings about the passage of time and weather, produce the best color rendition, regulate circadian rhythms in…

Discomfort Glare Metrics: Elusive, but not Illusive: A companion piece to The Elusive Discomfort Glare Metric

Naomi Miller’s essay “The Elusive Discomfort Glare Metric” highlights a number of questions within the lighting community about the causes of (and, hopefully, the cures for) discomfort glare, as well…
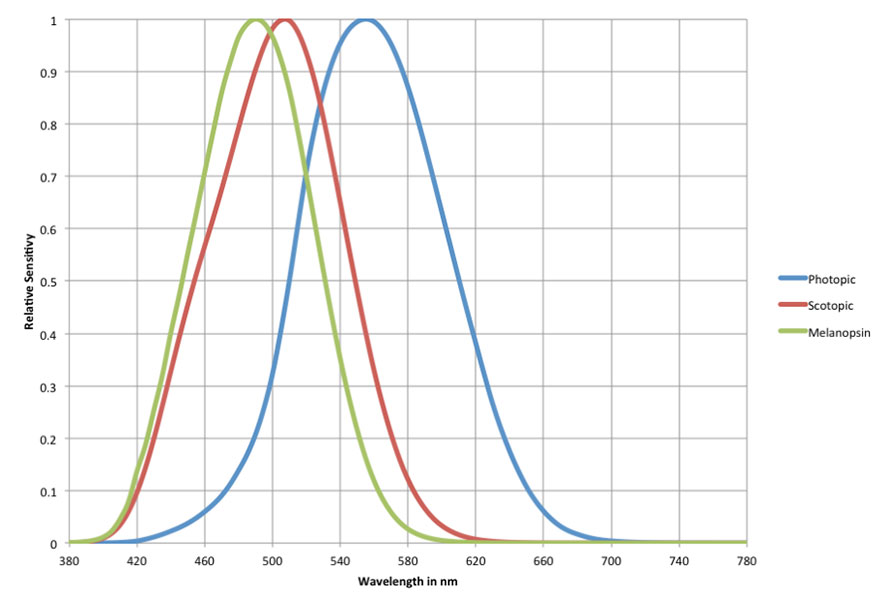
Figure 1.
Figure 1. Spectral sensitivity curve for melanopsin (green line), with the scotopic and photopic curves shown for comparison. The melanopsin function is taken from Lucas et al., 2014.

Simplifying Melanopsin Metrology

By Sam Berman, HFIES, Senior Scientist Emeritus Lawrence Berkeley National Laboratory and Robert Clear, FIES, Staff Scientist (Retired) Lawrence Berkeley National Laboratory During the past two decades, the lighting community…

Table 1. LED Luminaires with Different Masks and Intensities to Test Discomfort Glare from Luminaires with Non-uniform Luminous Apertures.

The Elusive Discomfort Glare Metric

By Naomi J Miller, FIES, Pacific Northwest National Laboratory In The Elusive Discomfort Glare Metric, Naomi J. Miller, FIES describes how the IES Discomfort Glare in Outside Nighttime Environments Committee…
Light + Quality

In Defense of Lighting Quality

By Darcie Chinnis, PhD, PE, IALD, MIES, LEED AP BD+C, WELL AP Lighting is often described as a balance of engineering and art – where creative aspirations are balanced with…
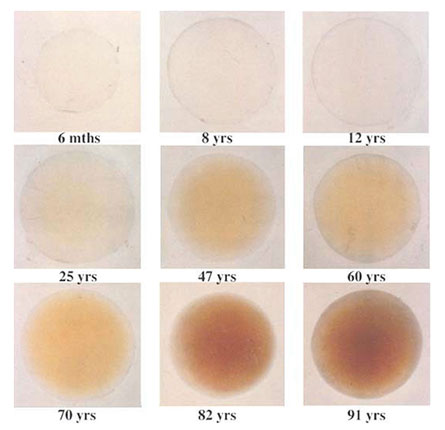
Figure 1.
Figure 1. Yellowing of the human lens of the eye with age.3

Circadian Lighting: a Neuroscientist’s Perspective

By Douglas Steel, Ph.D., NeuroSense The purpose of this article is to evaluate from a biological standpoint the rationale for the establishment of a Circadian Lighting standard put forward by…
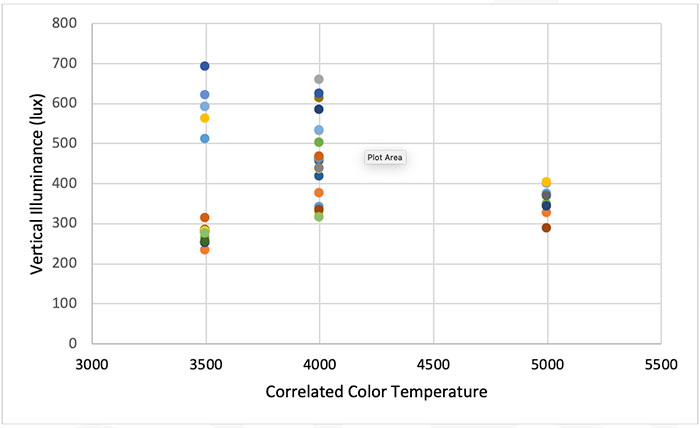
Figure 1.
Figure 1. Vertical illuminance required to achieve CS = 0.30 for different LED sources.

Circadian Lighting: An Engineer’s Perspective

By Ian Ashdown Whether you call it “circadian lighting,” “biologically effective lighting,” or some other name, the principle is the same: the color and intensity of light can be used…

An Intuitive Metric for Lumen Maintenance

An Intuitive Metric for Lumen Maintenance

By Eric Bretschneider For better or for worse, the lighting industry commonly associates the lifetime of LEDs and LED-based lighting products with L70 – the amount of time for the…

Figure 1: An example of the stroboscopic effect, measured with a short duty cycle and 100% modulation

Concerns in the Age of the LED: Temporal Light Artifacts

By Dr. James M. Gaines Flicker and stroboscopic effect are presently hot topics in lighting, along with other subjects like blue light (subject of a recent FIRES article). A National…
The Lighting Design Objectives (LiDOs) Procedure

By Christopher Cuttle, MA, PhD, FCIBSE, FIESANZ, FIESNA, FSLL This procedure is based on the concept that there is real advantage to be gained from changing the illumination metrics used…

M/P Figure 1
Figure 1. From left to right: spectral efficiency curves of the S-cone, ipRGC (melanopic), rod (scotopic), M-cone, photopic response, and L-cone, all normalized to a maximum of 1.

M/P ratios – Can we agree on how to calculate them?

By Naomi J. Miller, PNNL; Anne (Lia) Irvin, PNNL The candela and the lumen are units based on one form of human spectral sensitivity, characterized with the weighting function known…
Figure 1. Typical HPS lamp spectral power distribution versus McCree curve.

Specifying LED Colors for Horticultural Lighting

By Ian Ashdown, Senior Scientist SunTracker Technologies Whereas human vision relies on five opsins as photoreceptors, most plants have a wide variety of photopigments that are responsive to optical radiation…
Figure 2.
Figure 2. Images a – b: comparison of HDR and equivalent Perez sky; images c – f: vertical viewpoints captured at eye level under the sky shown in a.

Focusing on Daylight Spectra

By Mehlika Inanici, Ph.D. The dynamic intensity and spectra of daylight inform human beings about the passage of time and weather, produce the best color rendition, regulate circadian rhythms in…

Discomfort Glare Metrics: Elusive, but not Illusive: A companion piece to The Elusive Discomfort Glare Metric

Naomi Miller's essay "The Elusive Discomfort Glare Metric" highlights a number of questions within the lighting community about the causes of (and, hopefully, the cures for) discomfort glare, as well…
Figure 1.
Figure 1. Spectral sensitivity curve for melanopsin (green line), with the scotopic and photopic curves shown for comparison. The melanopsin function is taken from Lucas et al., 2014.

Simplifying Melanopsin Metrology

By Sam Berman, HFIES, Senior Scientist Emeritus Lawrence Berkeley National Laboratory and Robert Clear, FIES, Staff Scientist (Retired) Lawrence Berkeley National Laboratory During the past two decades, the lighting community…
Table 1. LED Luminaires with Different Masks and Intensities to Test Discomfort Glare from Luminaires with Non-uniform Luminous Apertures.

The Elusive Discomfort Glare Metric

By Naomi J Miller, FIES, Pacific Northwest National Laboratory In The Elusive Discomfort Glare Metric, Naomi J. Miller, FIES describes how the IES Discomfort Glare in Outside Nighttime Environments Committee…
Light + Quality

In Defense of Lighting Quality

By Darcie Chinnis, PhD, PE, IALD, MIES, LEED AP BD+C, WELL AP Lighting is often described as a balance of engineering and art – where creative aspirations are balanced with…
Figure 1.
Figure 1. Yellowing of the human lens of the eye with age.3

Circadian Lighting: a Neuroscientist’s Perspective

By Douglas Steel, Ph.D., NeuroSense The purpose of this article is to evaluate from a biological standpoint the rationale for the establishment of a Circadian Lighting standard put forward by…
Figure 1.
Figure 1. Vertical illuminance required to achieve CS = 0.30 for different LED sources.

Circadian Lighting: An Engineer’s Perspective

By Ian Ashdown Whether you call it “circadian lighting,” “biologically effective lighting,” or some other name, the principle is the same: the color and intensity of light can be used…
An Intuitive Metric for Lumen Maintenance

An Intuitive Metric for Lumen Maintenance

By Eric Bretschneider For better or for worse, the lighting industry commonly associates the lifetime of LEDs and LED-based lighting products with L70 – the amount of time for the…
Figure 1: An example of the stroboscopic effect, measured with a short duty cycle and 100% modulation

Concerns in the Age of the LED: Temporal Light Artifacts

By Dr. James M. Gaines Flicker and stroboscopic effect are presently hot topics in lighting, along with other subjects like blue light (subject of a recent FIRES article). A National…

The Lighting Design Objectives (LiDOs) Procedure

By Christopher Cuttle, MA, PhD, FCIBSE, FIESANZ, FIESNA, FSLL This procedure is based on the concept that there is real advantage to be gained from changing the illumination metrics used…