Many of the benefits of LED streetlights are proven and accepted, and cities and electric utilities are replacing their aged installed base of high-pressure sodium (HPS) and metal halide (MH) with LED. However, in many instances, the benefits of these new lighting systems are compromised by aging electrical distribution systems, extreme weather, and the possibility that some LED streetlights may not be designed to function as intended during non-ideal circumstances. For example, power line disturbances that result in voltages outside of the rated LED driver operating range can cause intermittent service disruptions or compromise reliability and lifetime, potentially resulting in dangerous lighting conditions.
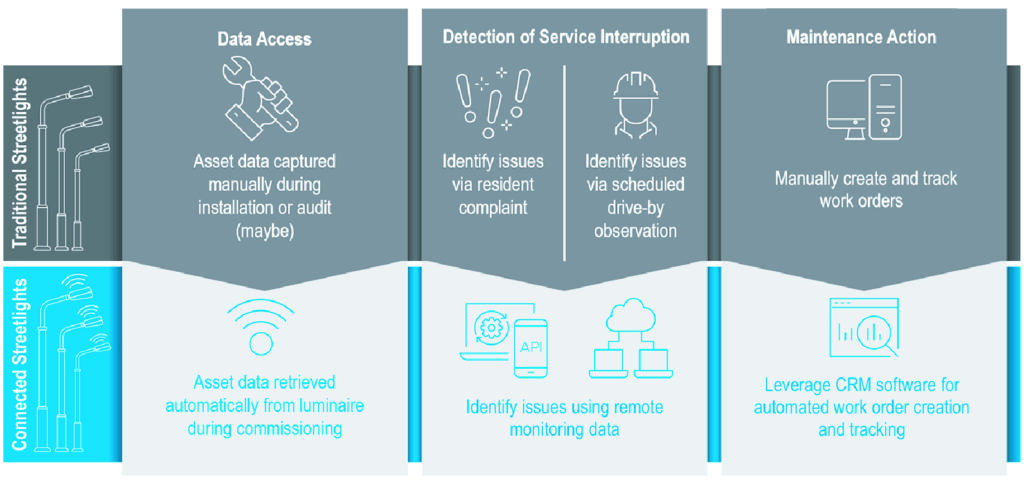
Connected lighting systems (CLS) that offer remote monitoring and promise sophisticated lighting control strategies and improved maintenance efficiency have been on the market for many years, but their deployment remains limited. In principle, CLS improve upon traditional maintenance practices by automating what are typically manual, in-person tasks, as summarized in Figure 1. Remotely monitored data can be used to alert maintenance staff as soon as a service disruption occurs. If the fault location is properly determined, a maintenance crew can automatically retrieve asset data (the fixture make, model and nominal light output) from an asset management database, or in some cases directly from the faulted device, and optimize transit to service the device. If the fault is properly diagnosed and the correct maintenance action is determined, the crew should be able to complete the required maintenance action in a single trip.
The use of CLS to improve maintenance efficiency holds much promise but remains far from standard practice. The data provided by deployed CLS may not always lead directly to fault detection, diagnosis and maintenance actions. For example, a service disruption resulting from a luminaire not providing light or operating at low light intensity can be detected by monitoring the driver output voltage and current, then comparing these values to defined thresholds. But different types of lighting service disruptions, and the ways to detect and differentiate between them, are not yet well-defined in recommended practice, leaving maintenance staff struggling to set useful thresholds. And while a voltage or current that is outside a user-defined high or low threshold may be an indication that a service disruption has occurred, questions remain about the cause of the fault. Did the LED driver fail? Is a connector or wire broken? Additional data and analysis are likely required to diagnose the cause of the disruption.

Pacific Northwest National Laboratory (PNNL) has been investigating barriers to realizing the potential of CLS to improve maintenance efficiency for a number of years. One of the fundamental barriers appears to be a lack of well-defined and documented faults for various lighting system equipment, and a mapping of possible detection schemes for each fault that leverages monitoring data available in commercially available products. We have been identifying common lighting system faults from literature reviews, stakeholder engagements and laboratory investigations. With a focus on street lighting systems and the aging electrical distribution infrastructure commonly found in older cities, we recently investigated the type and prevalence of luminaire service disruptions that might result from long-duration undervoltage disturbances. Streetlights from 12 different luminaire manufacturers containing LED drivers from seven different manufacturers were exposed to undervoltage conditions in our Connected Lighting Test Bed. Service disruptions were observed and characterized, faults associated with unique service disruptions were named and defined, and electrical data from circuit-level meters were used to imagine possible automated fault detection schemes. The study sought to answer the following research questions:
- Do long-duration—specifically lasting more than one minute—input voltage deviations (e.g., undervoltage) cause any LED streetlight service disruptions?
- What LED streetlight service disruptions (e.g., reduced or strobing light output) can result from long-duration input voltage deviations?
- Do any of the LED streetlight service disruptions that result from long-duration input voltage deviations persist once the input voltage returns to nominal conditions?
- What unique streetlight faults can be defined based on the observed service disruptions?
- How can the identified LED streetlight faults be automatically detected using data from commercially available CLS?
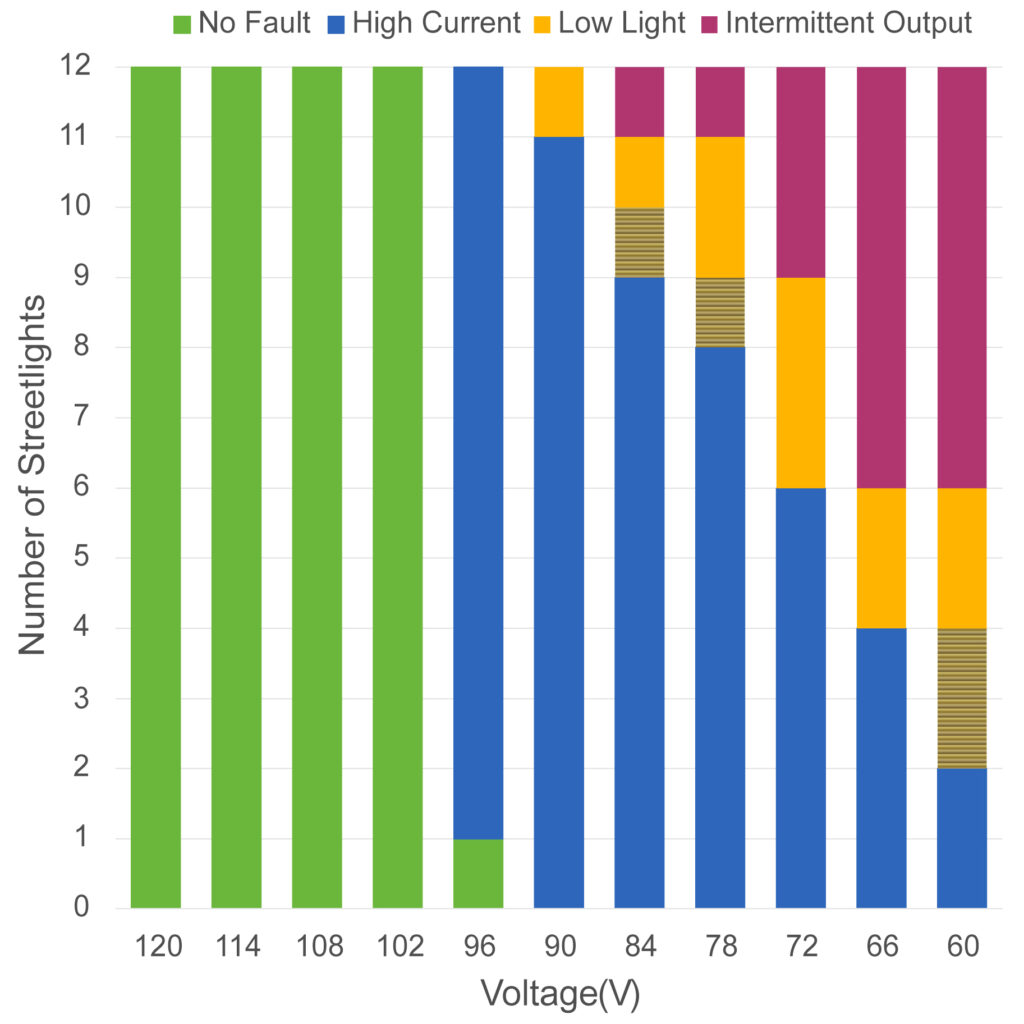
The luminaire input voltage of a streetlight might experience an undervoltage condition for many different reasons, and the study didn’t attempt to identify or replicate those causes. Testing emulated the undervoltage condition via the use of a programmable power supply. Ten undervoltage conditions were created, spanning the range from a nominal input voltage of 120 VAC down to 60 VAC. Human observation of the streetlight response to the undervoltage condition was used to identify service disruptions. Testing identified three different luminaire faults that can result from an undervoltage condition: “Luminaire: High Current,” “Luminaire: Low Light,” and “Luminaire: Intermittent Output.”

Notably, not all streetlights behaved identically. More specifically, not all streetlights exhibited all three fault types identified in the study. All tested streetlights performed as expected for the first three undervoltage conditions. However, as the input voltage decreased below 102 volts, streetlights exhibited one or more of the identified faults at each evaluated test condition. As shown in Figure 2, all 12 streetlights exhibited the “Luminaire: High Current” fault, 5 of 12 streetlights exhibited a “Luminaire: Low Light” fault, and 6 of 12 streetlights exhibited a “Luminaire: Intermittent Output” fault.
It is possible, if not likely, that some aspects of the varying response of the luminaires and drivers tested are intentional—by design. Further, luminaire fault behavior was shown to be dependent on LED driver choice, design and alignment with LED module load rating. Fault detection schemes were proposed for identifying the “high likelihood of a fault,” and the likely occurrence of each of the three identified faults. A fault detection scheme that utilized input voltage was found to only be useful for determining whether a fault has (most likely) not occurred or whether a fault may have occurred. Discerning between these three faults requires the additional measurement and monitoring of the input current draw of the luminaire and/or LED driver and the input power of the luminaire. Owners and operators of lighting systems that have the ability to monitor the conditions specified by the fault detection work will apply to other electrical systems beyond lighting, which in turn will motivate additional research and further conversations among organizations developing standards about test and measurement procedures and performance classifications for lighting products operating under degraded electrical conditions.
Much more research in this area is needed, and PNNL plans to conduct follow-up studies focused on identifying additional faults in luminaires and other lighting equipment and demonstrating potential automated fault detection and diagnostics schemes. In the meantime, the study offers recommendations to key stakeholders, including end users, LED luminaire and driver manufacturers, and standards and specification development organizations.
Learn more by downloading the full study at https://www.energy.gov/eere/ssl/sensorsand-fault-detection.


