Editorial Disclaimer
The views expressed in articles published on FIRES do not necessarily reflect those of IES or represent endorsement by the IES.
This article is an expanded version the article found in the 50th Anniversary issue of LD+A, July 2021, providing additional background, more references, and personal insights by the author.
By Brian Liebel
IES Director of Standards and Research
“In the development of any science, the first received paradigm is usually felt to account quite successfully for most of the observations and experiments easily accessible to that science’s practitioners … The more precise and far-reaching that paradigm is, the more sensitive an indicator it provides of anomaly and hence of an occasion for paradigm change … The very fact that a significant scientific novelty so often emerges simultaneously from several laboratories is an index both to the strongly traditional nature of normal science and to the completeness with which that traditional pursuit prepares the way for its own change.”
— T.S. Kuhn, The Structure of Scientific Revolutions (emphasis added)
Our First Lighting Measurement Paradigm
In 1906, when the Illuminating Engineering Society was formed, a central riddle needed to be solved – how to define and measure light. At that time, over 100 years ago, we were converting from gas to electric lighting as our main source of illumination; simply put, the more predictable conversion of electricity to light allowed us to more precisely create a system for standardizing light output measurements. The basic premise of this challenge was to establish a set of metrics for correlating light quantities to human vision in order to more reliably design and engineer lighting systems.
Which means, of course, that we had to first establish what we mean by “human vision.”
This is not a trivial challenge, and the procedures used over 100 years ago were limited. But before we get to the result, let’s look at an example of how to develop a set of metrics through the physical attribute, size. The concept of size answers the question, how big is this? First, we establish a base quantity (length, which is the distance between two points in a straight line), and we then define a base unit of length (meter) that can be replicated and standardized throughout the world. From that base quantity of length are the derived quantities of area and volume. Pretty simple, right? Now let’s define light and answer our question, how much light is this?
That one’s not so easy, is it? In fact, the first thing we have to decide is what we want the base quantity of light to represent; it’s not like the straight-line distance between points A and B !
Our idea behind lighting metrics over the last century has been to measure the human response to light by our sensation of brightness. While size is purely a physical measurement, the human sensation of brightness changes with different wavelengths in the (human) visible spectrum, and the only way to test for this is through psychophysical testing, which requires human interpretation. Once the sensitivities to these wavelengths are known, we mathematically integrate them with unadulterated radiometric values on a per-wavelength basis to calculate “how much light” is coming from a source. Compared to size, determining a metric for brightness is inherently more complicated and less precise.
Ah, but there’s the rub. We don’t define the term brightness by measurement! In fact, we refer to brightness as a visual sensation, or perception, different from the measurement system we created. So what are we measuring, exactly?
In 1924 the CIE adopted the luminous efficiency function, V(λ), largely influenced by the work of Gibson and Tyndall’s 1923 paper, Visibility of Radiant Energy.1, 2, 3 Even the title tells you the intent, to determine a quantitative method for measuring how radiant energy affects human vision, and within the paper it is clear that by ”visibility” they meant brightness. According to their paper, there had been several other tests of visibility that used a combined total of approximately 250 observers, and there were two methods employed at that time that had been considered reliable.4 The method used in the 1923 Gibson and Tyndall paper was the step-by-step method, which was an equality-of-brightness method with reportedly little or no hue differences between the compared sources. The paper then compared these values with flicker research of that era, and proposed a curve that best fit the combination of results from a number of studies, leading to the V(λ) curve. It is worth noting a few test conditions in the Gibson and Tyndall paper:
- 52 total subjects
- 45 males, age range 21 to 54 years
- 7 females, age range 25 to 38 years
- Test aperture was limited to 3 degrees, and the results were compared to flicker tests of 2 degrees
The limitations of these tests should be obvious, and in fact were acknowledged by the authors in their summary statements about future studies (emphasis added):
“Further statistical investigations would not seem to be as important as investigations into the effect of experimental conditions, such as field size and brightness, upon the visibility obtained by the two common methods of photometry.”
and:
“The step-by-step equality-of-brightness method should be used … and the investigation extended to include many more observers.”
While the small number of subjects is an acknowledged limitation, the correlation of the findings to previous research using flicker photometry gave confidence in moving forward with adopting V(λ). The bigger problem is that natural human binocular vision has a visual field of 190 degrees horizontal and 135 degrees vertical, and the extremely confined 2- and 3-degree fields of view used in these tests occlude over 99% of the photoreceptors in the retina that naturally receive light and affect our vision. An example of what this means is shown in Figure 1.

In principle, the occlusion of most of the full field of view as seen by a pair of human eyes should limit the application of V(λ) to those 2- or 3-degree situations that approximate the conditions of the studies – a dark surround with a small illuminated target on-axis with the fovea. Yet we use the V(λ) function for all of our vision-based lighting metrics.
What strikes the reader about the Gibson and Tyndall research are the imprecision and burning questions voiced by the authors even in their time, and it leaves the question of whether they ever intended their document to have the power it did when it became the basis of our system of lighting measurements. There are serious doubts expressed, and assumptions made that they intended should be resolved through future research, but such was not the case. Instead, the adopted curve that defines light as we know it is the smoothed-out version of compiled data from three different studies, one of which was used admittedly “for lack of any good reason for changing them, but the relative as well as absolute values are very uncertain and must be considered as tentative only.” As it happens, that portion of the adopted curve lay in the short-wavelength region.
The Anomaly
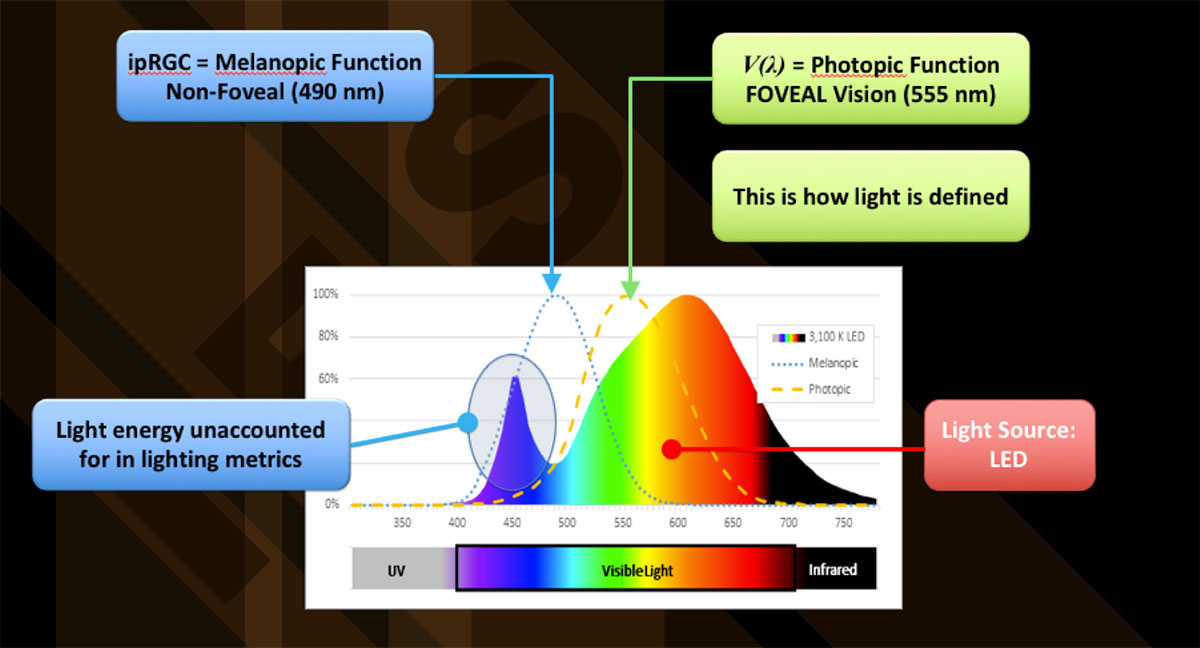
The limitations of V(λ)have been known for some time; the limited field of view basically represents a foveal response of the L- and M-cones, including only a relatively small number of S-cones and excluding the rods and the intrinsically photosensitive retinal ganglion cells (ipRGC) altogether. While the weighting function of V(λ) has its peak sensitivity at 555 nm, the excluded photoreceptors have peaks in the blue region (approximately 480 nm for ipRGCs and 507 nm for rods), and light sources with relatively higher blue content are perceived as brighter.5 Figure 2 shows these various spectral curves superimposed over an SPD for one type of LED. While early contemporary studies that allowed observations of a full field of view attributed this brightness effect to the rods, current studies are directing us to the ipRGC class of photoreceptors, and there is a growing contingency of scientists adding to this body of knowledge.6, 7, 8, 9 Now, with more studies, peer-reviewed articles, and non-peer-reviewed preprint manuscripts on human retina physiology in the last two years than in the previous 50 years,10 we are better situated than ever to address the disconnect between measured light and the thing that we actually want to measure, which is brightness. Moreover, we have more evidence compelling us to do so, given the impacts on vision, health, and well-being.

While most of the attention on ipRGC photoreceptors has been given to their role in circadian and other non-visual impacts, newer evidence points to the ipRGCs and their melanopsin-driven responses contributing to brightness perception in humans as well as serving fundamental functions in aspects of light adaptation.11 As we learn more about the ipRGC and its subtypes, the evidence is even indicating that individual types may affect image-forming functions like contrast sensitivity and color opponency.12 A recent review article states the importance of these findings succinctly: “There is an equally urgent requirement to incorporate melanopsin into models of perceptual vision. It has been suggested that the melanopic brightness percept is equivalent to that provided by luminance.”11
You might want to read that last sentence one more time, and take a breath before continuing.
The science behind our visual system has catapulted its way into prominence once again, and it is ever so timely. Recall that over 100 years ago we were converting from gas lighting to electric lighting, and we needed to develop a refined, reliable, and predictable measurement system for light. We are living that same experience now, with the ability to fine-tune light spectra to whatever we want, at whatever intensities we want, in whatever direction we want, at whatever time we want, and for whatever time interval we want. Yet we cannot fully describe its potential for advancing our lives, because our metrics simply do not allow for it. We are blindfolded by our existing lighting metrics, and it is time for us to see again. We need to rethink lighting metrics altogether.
There are three main reasons why we need to squarely address this issue:
- Visual metrics: While we could continue using approximations and correction factors for V(λ), as long as we continue to use the crutch of V(λ) we are limiting the real discovery and potential for a new vision science model. Similar to how the limitations of CRI were confronted through IES TM-30-15, we need to face the music and address these issues squarely. For instance:
- As a scientific community, we owe it to ourselves and society to admit that the limitations of our 100-year-old system prevent us from meeting the needs of lighting today, given the variances and variability in light source spectrum and the monumental shift in our understanding light and vision. It is time for us to recalibrate, because if we don’t, the levels of confusion we are seeing now will only amplify as we try to make unreasonable conversions from a system whose main reliability is that it has been given the status of defining one of seven fundamental SI units.
- How do we solve glare, when it is defined as excessive brightness ratios that vary with the state of adaptation but does not include the ipRGC brightness response and its possible role in adaptation? If we don’t change, the spectral aspect of glare will continue to plague us as an artifact of color, simply because our base measurements do not accurately measure brightness to begin with.
- How do we develop a system of mesopic photometry if the upper boundary from the scotopic region to the photopic is questionable? For that matter, are we really assured that the boundary conditions are correct, given new findings in vision science?
- Energy and economics: Lighting energy consumption has been founded on light source efficacy, which is measured in lumens per watt. The lumen is our current metric for how much light is coming from a light source, and light source efficacy is supposed to calculate the ratio of effective light for human visual purposes to the input watts of power consumed to create that light. If lumens do not correctly describe effective light, then we are potentially missing out on a great deal of energy efficiency. With new abilities to control light spectrum and an emphasis on lighting application efficiency and non-energy benefits, it is timely to migrate to a more robust set of vision metrics that can reduce our carbon footprint and improve the quality of light.
- Human health: Understanding how ipRGCs operate in the human eye in health and disease will enable new applications for lighting, but only if they are correlated with the visual environment and vision metrics in a way that is transferable and understandable. We have gone through numerous mathematical gymnastics to find ways to convert our lighting metrics to something that might correlate with ipRGC-driven non-visual effects, but it would be far better to reevaluate and correct the omission of the ipRGCs from our system of lighting measurements to begin with. It is highly likely that once we do this, some of our anomalous questions of trying to balance illuminance with health impacts could be more easily resolved.
Preparing the Way for Our Own Change
We are now at a point where we have sufficient information and technology to tackle this problem. We have: 1) the ability to create almost any SPD we want through LED technologies; 2) the controls to vary the intensity and SPD of light sources reliably and repeatedly; 3) a good understanding of the mechanisms that are driving our visual responses, and ways to measure them; 4) very accurate measurement equipment to monitor and report results; and 5) all the computer power we need, including artificial intelligence and machine learning, to create a pathway of discovery for how we should measure light.
The past 25 years of being heavily involved in this research have taught me that we need a collaborative approach from the broader research community that includes lighting, vision science, biology, neurology, and experimental psychology in order to solve this lighting metric conundrum. This requires new thinking – a 21st-century approach to confronting this 100-year-old paradigm. Here is my proposal:
Let’s first admit that, given what we know today, we would not accept the 1924 V(λ) curve as a satisfactory model for creating a system of measuring light. This is not to disparage the past; it is to open the door to ignoring it and starting fresh with current knowledge.
Next, let’s ask the more appropriate question: Given what we know today, how would we create a testing protocol to develop a new system of lighting measurements that will answer the question, how much light is this? Using recent experiments and the researchers who conducted them, we could gather a panel of experts to develop a protocol for testing human vision that has these basic parameters:
- Full field of view testing
- Color-mixing of light sources illuminating a spectrally neutral background
- Sequential brightness matching testing, throughout the visible range
- Infrared pupillometry and other objective measurements
- Testing that includes a wide range of light levels and observer ages
- Numerous subjects in several testing facilities, all using the same protocol and calibrated equipment
- All test results connected via the internet for central processing and review by all labs performing the testing
While this sounds like a lot, it’s not that difficult to build the systems for testing.13 What will take time is developing and agreeing on a protocol and the associated computer programming to interpret results that will show us where the evidence is pointing. We should not have any preconceived notions … let the eyes have at it, and we can learn from this century’s attempt to develop a more holistic and modern paradigm of lighting metrics.
FOOTNOTES
1 Johnston SF. A History of Light and Colour Measurement. London: Institute of Physics Publishing; 2001
2 Gibson, K, Tyndall, E. Scientific Papers of the Bureau of Standards, Volume 19 (475). Washington, DC: U.S. Department of Commerce; 1923
3 Hardis JE. A Century of Excellence in Measurements, Standards, and Technology: Visibility of Radiant Energy. CRC Press. 2002.
4 The two methods were: 1) equality-of-brightness with simultaneous comparison; and 2) flicker method with alternating comparisons. The equality-of-brightness method was considered more capable of greater precision but failed when comparing light sources of significantly different hues, and the step-by-step method used in their paper resolved this problem.
5 Interestingly, Gibson and Tyndall noted the following in their 1923 paper: “A peculiarity which might be noted is the apparent irregularity in the blue,” noting an effective brightness at 480 nm that was higher than at 460, 470, or 490 nm and about equal to that of 500 and 525 nm. And: “The magnitude of this effect at 480 is clearly outside of any possible error connected with stray light, size of step, or energy distribution … the effect of change in the size of field was not tested.”
6 Berman SM, Jewett DJ, Fein G, Salka G, Ashford F. Photopic luminance does not always predict perceived room brightness. Light Res Technol. 1990; 22:37-41.
7 Illuminating Engineering Society. ANSI/IES LS-8-20, Lighting Science: Vision – Perceptions and Performance. New York: IES; 2020.
8 Brown TM, Tsujimura S, Allen AE, Wynne G, et al. Melanopsin-based brightness discrimination in mice and humans. Current Bio. 2012;22:1134-41
9 Schlessleman B, Gordin M, Boxler L, Schultz J, Berman S, Liebel B, Clear B. Melanopic enhanced metameric white lightings make a simulated sports field appear brighter allowing a trade-off between photopic intensity and melanopic content. Proc IES Annual Conf, 2015.
10 Mure LS. Intrisically photosensitive retinal ganglion cells of the human retina. Front Neurol. 2021;12(636330).
11 Lucas RJ, Allen AE, Milosavljevic N, Storchi R, Woelders T. Can we see with melanopsin. Annual Review Vision Sci. 2020;6:453-68.
12 Sondereker KB, Stabio ME, Renna JM. Crosstalk: The diversity of melanopsin ganglion cell types has begun to challenge the canonical divide between image-forming and non-image-forming vision. J Compar Neurol. 2020:1-24
13 A starting point could be the “What is Bright” portable system developed as a follow up to the Schlessleman et al. experiment (Ref. 9) that has been to the IES Annual Conference, the IES Research Symposium, NIST, and PNNL.


