
Editorial Disclaimer
The views expressed in articles published on FIRES do not necessarily reflect those of IES or represent endorsement by the IES.
By Jason Livingston (Studio T+L), Michael Royer (PNNL), Lorne Whitehead (University of British Columbia)
It seems that every month there is a new metric proposed to quantify the performance of light sources, particularly with respect to spectral properties. One of the latest examples is Average Spectral Difference (ASD), a metric developed by Bridgelux that is claimed to quantify the “naturalness” of a light source and its value for “human-centric lighting.” In this post we examine the concept of spectral similarity and evaluate the claims made by Bridgelux regarding ASD.
Background
The May 2020 Bridgelux white paper, Average Spectral Difference, a new method to make objective comparisons of naturalness between light sources, asserts that since humans evolved under fire light and daylight, “human-centric lighting” should use spectra that mimic these “natural” sources. It claims that existing metrics cannot capture this aspect of lighting and presents a “new method” (ASD) to characterize this aspect of lighting quality. The white paper goes on to say, “ASD provides an objective measurement of how closely a light source matches natural light over the visible spectrum, averaging the differences of the spectral peaks and valleys between a light source and a standardized natural light source of the same CCT.” The standardized light sources are the same reference spectra as used in ANSI/IES TM-30-18 (TM-30)1 and CIE 224:20172: Planckian radiation below 4000 K, CIE D Series illuminants above 5000 K, and a proportional blend in between. ASD is expressed as a percentage, with lower percentages equaling a smaller average difference from, or closer match to, the reference source. Conversely, a higher score indicates a larger difference between the two. The match is calculated in a uniform manner over a specified wavelength band of 425 nm to 690 nm, while visible wavelengths outside that band are ignored.
Here, we specifically address three aspects of this proposal:
- Its context within the history of metrics related to spectral quality
- Its definition of naturalness and possible relevance to human wellbeing
- The mechanics of the proposed ASD calculation and its relationship to human vision
A History of Spectral Difference
Spectral similarity metrics are not new. In fact, they predate the now-outdated CRI, with origins in the work of Bouma from late 1930s,3 when the idea was known as the spectral bands method. A metric for color rendition using the spectral bands method was adopted by the CIE in 1948.4 Investigation of this concept continued through the 1950s, with the number of bands, their dividing wavelengths, and their relative weighting investigated by numerous researchers.5-16 This spectral bands method was the counterpart to the test color method, which is the philosophy behind CRI (first adopted in 1965), TM-30, and almost all other color rendition measures. The spectral bands method was ultimately abandoned, as described by Bouma in 1971: “… it soon appeared to be unsatisfactory and although numerous attempts have been made to eliminate its shortcomings … a completely satisfactory solution has never been attained.”
Spectral similarity metrics garnered more attention with the proliferation of solid-state lighting. At least three proposals preceded ASD: Percent Deviation from Daylight (mm%Dxx),17 the Spectral Similarity Index (SSI),18 and the Daylight Spectrum Index (DSI).19 These are all slightly different takes on the idea of spectral similarity. For example, mm%Dxx uses 10-nm bands from 420 to 650 nm and allows an exemption that three bands can exceed a defined percent deviation from a CCT-matched D Series illuminant, SSI is based on the deviation of a smoothed test SPD in 10-nm bands from 380 nm to 670 nm compared to either a tungsten or daylight reference, and DSI is based on the ratio of radiant power weighted using three color-matching functions for a test source to the radiant power of a D Series illuminant. The motivation behind these methods varies, respectively, from an overall improvement in quality, to spectral consistency for cinematographic applications, to a measure of color quality. While spectral similarity is easily defined and calculated, that doesn’t establish that it provides useful information, which is perhaps the reason no previous spectral similarity metric has gained traction in the lighting community.
Naturalness and Its Benefits
ASD has been proposed specifically as an indicator of “naturalness,” which is not a scientific term. Apparently, there is an expectation that this characteristic has benefits for both color perception and nonvisual effects of optical radiation (e.g., circadian synchronization). Bridgelux presents a definition of “natural” light that is based on the illuminants commonly used as references for color rendering metrics, but there is actually no accepted definition of “naturalness” in the scientific community, the lighting industry, or most other industries for that matter. The same is true of the term “human-centric lighting.”20 The white paper makes several claims related to both color and human-centric lighting but does not cite any supporting evidence linking naturalness (as defined) to human wellbeing. For example, it says, “There is a strong presumption among most lighting experts and HCL advocates that the more natural a light source is, the better for the observer.” It may seem obvious that light sources should mimic Planckian or daylight SPDs, but that alone doesn’t prove anything. Without a standardized definition of “natural” and an agreed-upon quantification of “better,” such claims are unsupported. Historically, unsupported claims have rarely advanced society and in some cases have been detrimental.
While many people assume that a Planckian or daylight spectrum is ideal, and while smooth SPDs can have advantages, SPDs more similar to Planckian radiation or daylight aren’t necessarily perceived as rendering colors more naturally (or in a more preferred way) in typical architectural lighting scenarios. This has been shown repeatedly in experiments,e.g.,21-29 where it has become quite evident that certain deviations from Planckian are preferred or viewed as more natural than others. Generally speaking, spectral similarity measures like ASD are not well correlated with people’s descriptions of the naturalness of a light source. For example, for the data from five studies21-25 that informed the development of TM-30 Annexes E and F, the correlation between ASD and participants’ ratings of the naturalness (or normalness) of the color appearance of illuminated objects was not very good, with r2 always under 0.30. In contrast, correlation was much better for combinations of TM-30 measures; specifically, r2 values for models using Rf, Rg, and Rcs,h1 exceeded 0.78 for each of the five studies. In other words, TM-30’s measures in combination predict subjects’ perceptions of the naturalness of the color appearance of objects far more accurately than does ASD. Importantly, no claims have been made that these color preference studies assess health benefits of light, which is an important area for future research. However, TM-30 does an excellent job of summarizing common human perceptions about the color qualities of illumination.
If ASD were to be considered as a metric for photobiological benefits, its value would be equally unclear. Simply reproducing a selected portion of the spectrum of daylight does not properly assess photobiological effects, especially since the intensity and other important factors are not considered. In fact, manipulating a light source’s spectrum away from the reference (i.e., increasing the ASD) can move its photobiological potential closer to exterior lighting conditions, counteracting the decidedly unnatural behavior of spending daytime hours indoors at light levels that are at least an order of magnitude less than outdoors. Thus, it is easy to see that reproducing a “natural” spectrum does not necessarily produce value for color quality, circadian synchronization or any other human-centric lighting goal. Furthermore, emphasizing a spectral match rather than optimizing the spectrum for maximum benefit per Watt (or joy per joule) is really a wasted opportunity to improve human wellbeing.
The Limitations of ASD
From a broader perspective, ASD, and spectral similarity measures in general, have numerous limitations. Conceptually, ASD disregards important fundamentals of human vision, including the principle of univariance and how color perception changes with intensity. Our visual system does not detect the wavelengths of individual photons, as ASD implies; instead, the various human photoreceptors exhibit wavelength-dependent sensitivities to light which govern both visual and nonvisual phenomena. In short, ASD assumes that all deviations from the reference are detectable and that they are all undesirable—neither of which is accurate.
Beyond its absence of evidentiary support, the Bridgelux ASD metric promotes a very old misconception – the idea that a complex set of human factors characteristics can be assessed along a single dimension. Seldom is such a simplistic approach appropriate for assessing human responses to stimuli. That was one of several fundamental problems with the now-outdated CRI metric that TM-30 solved in a transparent, open, non-commercial manner.
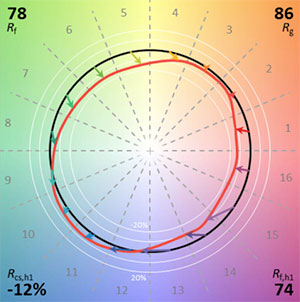
The Bridgelux white paper states, “While high CRI and TM‐30 values can be produced by a light source that has a poor (high) ASD value, a light source with a good (low) ASD value will always correspond to high CRI and TM‐30 ratings due to the naturalness of the light.” While that statement is true, on its own it is not useful. It is obvious that a light source with an ASD of 0% is acceptable for illumination, since the reference source, by definition, has an ASD of 0% and most people consider it acceptable for illumination. But that alone doesn’t make the ASD a proper metric. Useful metrics must demonstrate a strong correlation between a light sources’ score and at least some verifiable aspect of its value. In other words, if one source scores 30% and another scores 15%, most people should benefit in a demonstrated way from the one with the lower value. Given the nature of ASD as characterizing performance along a single dimension, it is not possible for ASD to distinguish deviations from the reference spectrum that have been shown to be desirable from those that have not. As such, it is easy to show an example in which ASD favors an obviously inferior light source. Consider the two metameric spectra plotted below and accompanied by their ANSI/IES TM-30 information, which were evaluated as part of a recent study on color quality25:

The light source on the left has a lower (better) ASD (34% versus 47%), but the one on the right was perceived by subjects as causing colored objects to appear more natural (a top rating of 100 compared to 35). It also has better color fidelity, and it slightly accentuates red tones in a way many find pleasant. In contrast, the spectrum on the left distorts colors more noticeably and reduces red-green color contrast in a manner many find undesirable.
Conclusion
Overall, it’s clear that ASD is not a useful tool for evaluating the human value of a light source. While spectral smoothness (as exemplified by the reference illuminants in ASD) is sometimes a useful goal, there are other metrics, more rooted in vision science, that better asses the human value of light sources illuminating the built environment.
This is a good example of why it is important to rely on metrics that have been vetted through a standardization process and to view marketing material with a healthy degree of skepticism. The development and publication of IES standards, by contrast, follows the ANSI process. ANSI’s Essential Requirements include a balance of the interest groups impacted by the standard, consideration of conflicting opinions during development, a consensus vote on the final standard, a period for review by the public, and an appeals process for any comments that are rejected by the consensus of the participants.
References
1 Illuminating Engineering Society. ANSI/IES TM-30-18, Technical Memorandum: IES Method for Evaluating Light Source Color Rendition. New York: IES; 2018.
2 International Commission on Illumination (CIE). CIE 224:2017, CIE 2017 Colour Fidelity Index for accurate scientific use. Vienna: CIE; 2017.
3 Bouma PJ. Colour reproduction in the use of different sources of “white” light. Philips Tech Rev. 1937;2(I):1-7.
4 International Commission on Illumination (CIE). No title. In: Recueil Des Travaux et Compte Rendu Des Séances: CIE 11th Session, Paris. Vienna: CIE;1948:5.
5 Jerome CW, Judd DB. Specification of color rendering properties of fluorescent lamps. Illum Eng. 1953;May:259-67.
6 Barnes BT. Band systems for appraisal of color rendition. J Opt Soc Am. 1957;47(12):1124. doi:10.1364/josa.47.001124
7 Zeitzer JM, Friedman L, Yesavage JA. Effectiveness of evening phototherapy for insomnia is reduced by bright daytime light exposure. Sleep Med. 2011;12(8):805-7. doi:10.1016/j.sleep.2011.02.005.
8 Jerome CW. Power in spectral bands as an evaluation of color rendering properties of light sources. J Illum Eng Soc. 1976;5(3):148-149. doi:10.1080/00994480.1976.10747763.
9 Crawford BH. Measurement of color rendering tolerances. J Opt Soc Am. 1959;49(12):1147-1156. doi:Doi 10.1364/Josa.49.001147.
10 Kruithof AA, Ouweltjes JL. Colour and colour rendering of tubular fluorescent lamps. Philips Tech Rev. 1956;18:249-61.
11 Winch GT, Ruff HR. Measurement, representation and specification of colour and colour rendering properties of light sources. Light Res Technol. 1951;16(1 IEStrans):13-25. doi:10.1177/147715355101600103.
12 Henderson ST, Waigh DT. The colour-rendering properties of fluorescent lamps and a proposed new method of specification. Light Res Technol. 1953;18(4 IEStrans):113-21. doi:10.1177/147715355301800402.
13 Harrison W. Assessment of colour rendering properties of fluorescent lamps. Light Light. 1951;April:148-52.
14 Harrison W. The Colour of Fluorescent Lamps. Light Res Technol. 1949;14(6 IEStrans):145-73. doi:10.1177/147715354901400601.
15 Crawford BH. Psychophysical measurements in colour rendering. Die Farbe. 1955;4(6):168-72.
16 Ouweltjes JL. The specification of colour rendering properties of fluorescent lamps. Trans Kansas Acad Sci. 1960;4(6):207-46. doi:10.2307/3626209
17 Kirkpatrick DA. Is solid state the future of lighting? In: Ferguson IT, Narendran N, DenBaars SP, Carrano JC, eds. Third International Conference on Solid State Lighting. Vol 5187. SPIE. 2004:10. doi:10.1117/12.514070.
18 Holm J, Maier T, Debevec P, et al. A cinematographic spectral similarity index. In: SMPTE 2016 – Annual Technical Conference and Exhibition. Vol 2016-January. Institute of Electrical and Electronics Engineers Inc. 2016:1-36. doi:10.5594/m001680.
19 Acosta I, Leon J, Bustamante P. Daylight Spectrum Index: A new metric to assess the affinity of light sources with daylighting. Energies. 2018;11(10):2545. doi:ARTN 254510.3390/en11102545.
20 Houser KW. Human Centric Lighting and Semantic Drift. LEUKOS – J Illum Eng Soc North Am. 2018;14(4):213-4. doi:10.1080/15502724.2018.1501234.
21 Royer MP, Wilkerson A, Wei M. Human perceptions of colour rendition at different chromaticities. Light Res Technol. 2018;50(7):965-94. doi:10.1177/1477153517725974.
22 Royer M, Wilkerson A, Wei M, Safranak S. Experimental validation of color rendition specification criteria based on ANSI/IES TM-30-18. Light Res Technol. 2019;52(3):323-49. doi:10.1177/1477153519857625.
23 Royer MP, Wilkerson A, Wei M, Houser K, Davis R. Human perceptions of colour rendition vary with average fidelity, average gamut, and gamut shape. Light Res Technol. 2016;49(8):966-91. doi:10.1177/1477153516663615.
24 Esposito T, Houser K. Models of colour quality over a wide range of spectral power distributions. Light Res Technol. 2019;51(3):331-52. doi:10.1177/1477153518765953.
25 Zhang F, Xu H, Feng H. Toward a unified model for predicting color quality of light sources. Appl Opt. 2017;56(29):8186-95. doi:10.1364/AO.56.008186.
26 Ohno Y, Fein G, Miller C. Vision Experiment on chroma saturation for color quality preference. In: 28th CIE Session. Vol 1; Manchester, UK. Vienna: International Commission on Illumination (CIE); 2015:2124.
27 Wei MC, Houser KW. Systematic Changes in Gamut Size Affect Color Preference. Leukos. 2017;13(1):23-32. doi:10.1080/15502724.2016.1192402.
28 Wei M, Houser KW, David A, Krames MR. Colour gamut size and shape influence colour preference. Light Res Technol. 2016;49(8):992-1014. doi:10.1177/1477153516651472.
29 Jost-Boissard S, Fontoynont M, Blanc-Gonnet J. Perceived lighting quality of LED sources for the presentation of fruit and vegetables. J Mod Opt. 2009;56(13):1420-32. doi:Pii 91354290610.1080/09500340903056550.