Saving energy while keeping the feel of sunset and flameBy Lorne Whitehead and Jason Livingston
Warm dim LED technology attempts to combine the energy efficiency of LEDs with the color shift and dimming range of an incandescent lamp. This is a tall order. Incandescent lamps are brilliant at replicating the romantic experiences of fading sunsets and campfires with their smooth color shift and consistently excellent low-range dimming, all without any concerns about control compatibility. Throughout the dimming range they also provide essentially perfect color fidelity—i.e., matching a broadband reference illuminant at the same color temperature—and emit plenty of far-red and infrared wavelengths, which are especially important for making complexions and food appear natural and pleasing. Not surprisingly, the desire to maintain these important characteristics is seen in restaurants and hospitality applications where the associated shifts of light output and spectrum have long been valued and enjoyed. Moreover, many consumers feel the same way about illumination in their homes. Unlike incandescent, when most LED lamps and luminaires dim, they maintain the same nominal spectrum, providing a different experience. Warm dim (a.k.a. warm glow, dim-to-warm) LED technology has several implementations, with variable success in mimicking the familiar experience of dimmed incandescent lamps.
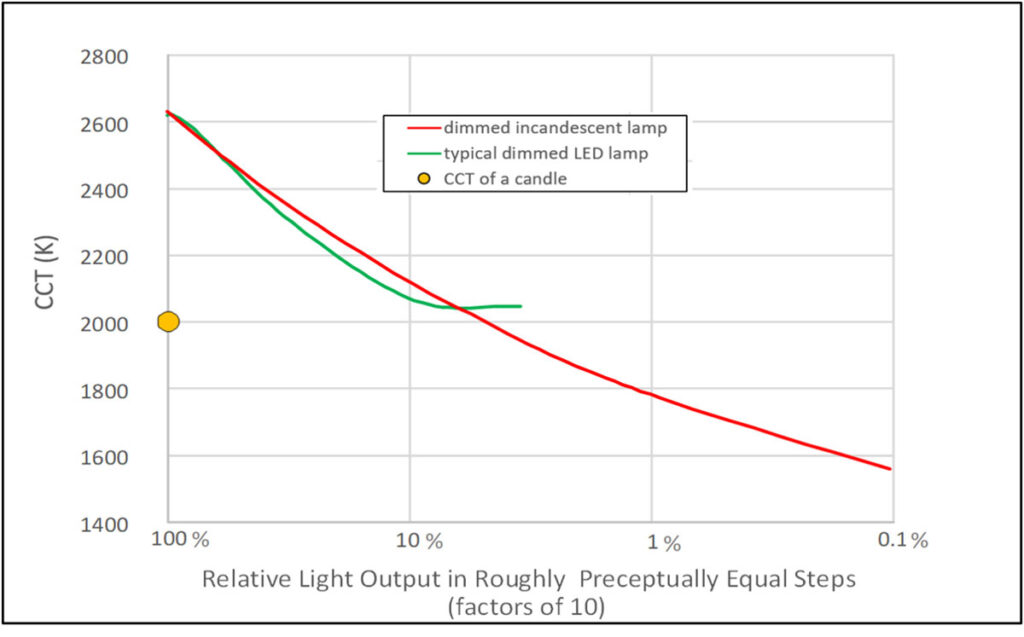
Let’s compare the dimming of an incandescent lamp with an example warm dim LED. Figure 1 illustrates how the correlated color temperature (CCT) changes with light output. The incandescent lamp (red curve) provides a thousand-fold range of light output as the appearance shifts from around 2700K white (at the left) to reddish-orange (around 1600K). In contrast, the example warm dim LED lamp (green curve) dims only about halfway toward the incandescent lamp’s perceived minimum controlled light output while its CCT shifts only about halfway toward the minimum for the incandescent lamp. This matters a lot, because in emotional terms, much of the “romance” of dimmed incandescent lighting lies on the right half of the plot. Dimming curves are important to evaluate and charts are often available for specifiers on product cut sheets. Note that many LED products are now creating a closer match to the incandescent curve, with lower minimum levels and lower CCTs. Unfortunately, CCT shift alone doesn’t tell the full story.

Another important issue for incandescent-like dimming is the spectrum and the light’s effect on the appearance of objects. Incandescent lamps maintain high color fidelity (TM-30 Rf) throughout the dimming range, but some warm dim LEDs have lower color fidelity (e.g., Rf <85) when dimmed, like the lamp for which a TM-30 report is provided in Figure 2. While in some cases lower Rf values may be acceptable to enable greater luminous efficacy, the power consumption at dim settings is already very small. In addition, if dim settings are more appealing, they may be selected more often, saving even more energy.
Even if color fidelity stays high, many complain about warm dim LEDs at the low end of the dim curve—where the appearance created is less “dim-to-warm” and more of a “dim-to-cantaloupe.” While lower light levels cause colors to dull (Hunt effect), incandescent lamps naturally counter this through increased far-red (>650 nm) wavelengths. LEDs, on the other hand, tend to limit this far-red emission to boost luminous efficacy, and miss the mark by adding more energy efficacious amber wavelengths around 600 nm instead.

Figure 3 compares the “spectral shape” (i.e., the spectral power distribution normalized for equal lumen output) of an incandescent lamp and an example LED at full output (120 volts) and dimmed (30 volts). While the incandescent curve for 30 volts is heavily weighted toward far-red (and infrared) emission, the LED significantly lacks the energy in these wavelengths that are especially important to color appearance in low-light applications.

Will specifying high-fidelity sources solve this issue? Not always. Specifiers should keep in mind that color vision science to date does not put the primary focus (understandably) on the near infrared edge of the visual spectrum nor very warm color temperatures. For example, the ANSI C78.377 bins for chromaticity do not currently include bins for light sources below 2200K, and TM-30, though improved from CRI, may not fully capture the importance of the effect of far-red emission on color appearance in certain circumstances. When evaluating color quality of LEDs at warm color temperatures and low light levels, the SPD of the source can be an important datapoint. Don’t worry, this SPD curve is included in a TM-30-20 full report.
Low dimmed levels, CCT shifts, color rendering and far-red emission are all important to achieve the romance of a dimmed incandescent lamp. Likely, research and color metrics will continue to advance to allow better characterization of the ability of LEDs to match this performance. In the meantime, studying a fixture’s dimming curve, color rendering data and SPD can help specifiers estimate the extent to which their design goals will be fulfilled. When practical, it can be very helpful to carry out a visual test of representative surfaces—by comparing their appearances when illuminated by an appropriately dimmed incandescent lamp, to those achieved using various manufacturers’ warm dim LEDs.


